Here's an interesting finding from this morning's fiddling. I correlated performance on a task in the Memory Lab with performance on a task elsewhere (sorry, I'm being deliberately ambiguous for the moment). The correlation was significant and sizable at r = .93. Of course, any good researcher knows always plot your data, so here's how they look:
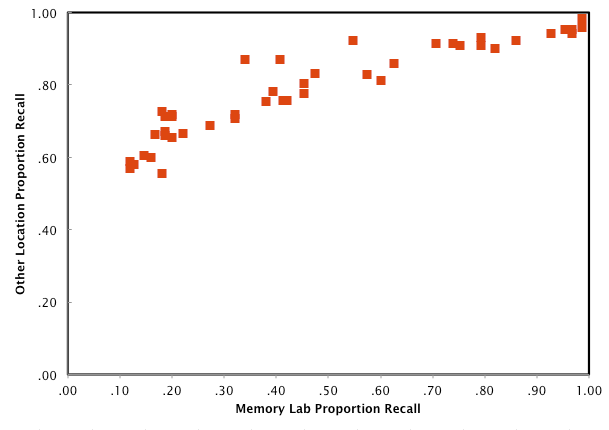
As you can see, the relationship looks somewhat logarithmic (or otherwise curvilinear). What causes that kind of relation? I'm pondering.